What a year this has been! Year to date 58% of stocks are lower. Only 42% are higher. Our universe is all stocks that have traded for at least six months. There are 5,102 stocks currently in that universe.
There is a bigger story however. There are 989 stocks that are up 20% or more. Even more telling is that there are 1,485 stocks down -20% or worse. If we remain at this level of decent sized losers, then the mutual funds will start to harvest tax losses in another month or two. This is what can cause bad price action the second half of August, September and October. We monitor this action so contact us to be kept up to date on how this progresses.
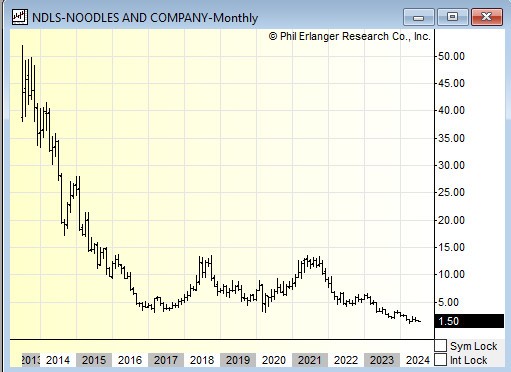
Now to the average price of the above statistics. First,1,616 stocks are under $5 in price. 2,198 stocks are under $10 in price and 2.988 stocks are under $20 in price. Yes, sport fans, that means close to 60% of all stocks are under $20. A key point on this is institutional investors often stay away from stocks under $5 so there is little to prop up the Noodles (NDLS) of the world that have fallen to $1.52 since a peak of $51.97 the first month it began trading in 2013.

Key ETFs to pay attention to are the Russell 2000 (IWM) and the iShares Micro Cap (IWC). Tracking these names will be vital as we head into late Summer/early Fall where corrections are born.
_______________
Geoff Garbacz is a principal at Quantitative Partners, Inc. and works with several independent research firms that work with buyside clients, financial advisors and institutional investors.
© 2026 Newsmax Finance. All rights reserved.