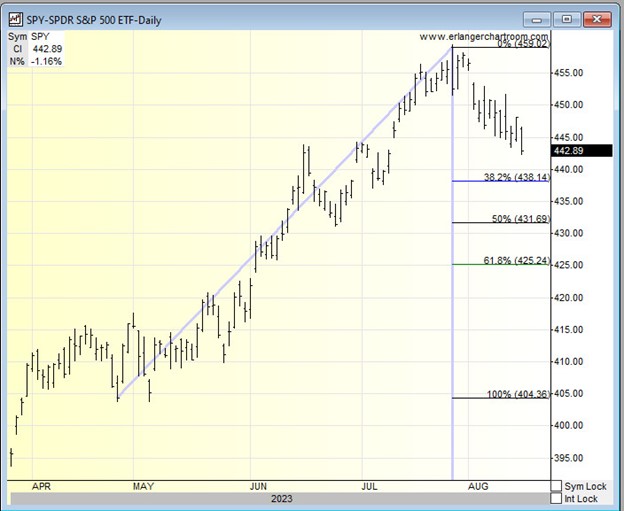
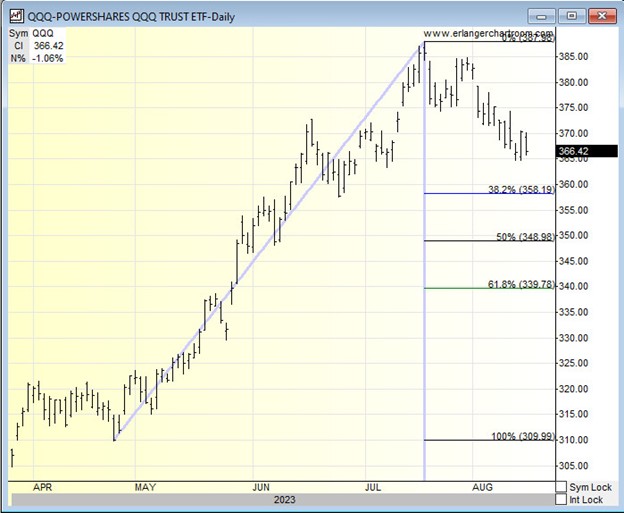
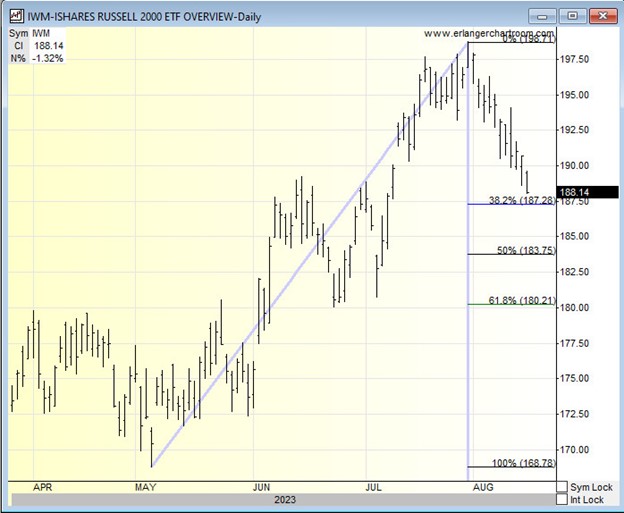
Stocks have been selling off since the end of July. This action is the first decent selling we have seen since the March low.
As such, it makes sense to look at the retracements on the major stock index ETFs as well as the major bond ETF, TLT.

The S&P 500 has been higher for five months since the March low. Therefore, a pullback is nothing too unusual. We like to use Fibonacci Retracement Levels. The first test is the 38.2% retracement of the move from the March low. It has yet to be tested but should be watched closely.

For the NASDAQ 100 we used a different tracking point on the retracement, the April low. Like SPY the QQQ has more downside before hitting its 38.2% retracement.

The Russell 2000 via IWM is closest to its 38.2% retracement. As such, it is also the most oversold. The ability to hold above $187.28 after a test that could happen today will be key to avoiding further downside on IWM.

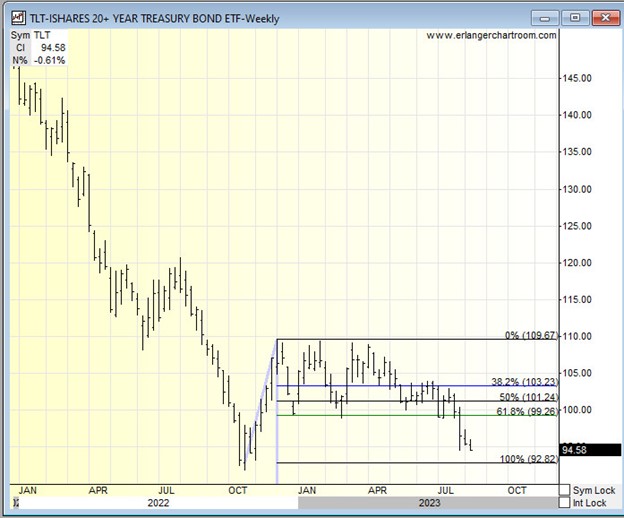
The retracement we used on the 20 Year Treasury ETF, TLT, is weekly. Key is holding the low from last October. A break of $92.82 could send yields to a new high.
We will revisit this next week and see how the price action is dealing with these levels.
_________________
Geoff Garbacz is a principal at Quantitative Partners, Inc. and works with several independent research firms that work with buyside clients, financial advisors and institutional investors.
© 2026 Newsmax Finance. All rights reserved.